2.4 Pests monitoring and forecasting
| Site: | TOPPlant Portal |
| Course: | Training Manual for Plant Protection in Organic Farming |
| Book: | 2.4 Pests monitoring and forecasting |
| Printed by: | Guest user |
| Date: | Thursday, 8 January 2026, 12:49 PM |
Pests monitoring and forecasting
Learning Outcomes:
- Learn the importance of pest monitoring and forecasting.
- Define the most popular and widely used monitoring techniques and explain their use in integrated pest management.
Many producers routinely apply pesticides plant protection products (PPP) on a calendar schedule when pest infestations are suspected or when pest populations are already high and difficult to control. The total cost of pest control over the production cycle can be expensive when calendar applications are used. Excessive spraying can render pesticides PPP ineffective by promoting pest resistance to pesticides; applications can cause phytotoxicity; increasing regulations make spraying more difficult.
In the European Union, integrated pest management (IPM) is used in conventional agricultural production. IPM is based on the integration of all available methods and tools with the aim of keeping the pest population below the threshold. The same approach is applied in organic production. The difference with conventional production as practised in the EU is that farmers can use chemical pesticides at IPM, while in organic production only a limited number of products can be used. Therefore, pest monitoring as one of the basic principles of IPM should also be used for pest management in organic farming.
In many cases, a certain number of pests and a low level of damage can be tolerated; this concept is fundamental to integrated pest management (IPM) It is difficult to set specific thresholds and guidelines because the significance of the presence of pests or damage depends on many factors, including the tolerance of the farmer.
It is best to start monitoring pest populations before introducing or changing pest control measures. Monitoring is the systematic collection, recording and analysis of observations over time. The most important thing is to learn what trap caches reflect compared to pest damage and crop quality. Then it is necessary to modify control measures based on monitoring information. Farmers who systematically monitor their crops can develop their own thresholds. Many numerical thresholds can be developed for most monitoring methods.
Insect pest monitoring
To control insect pests, it is necessary to first determine the damage situation and create an optimal control plan, considering the environmental conditions and characteristics. Insect pest monitoring is the first basic step for proper IPM and for proper plant protection in organic farming. Insects can be monitored using a variety of monitoring tools such as: pheromone traps, light traps, coloured sticky traps, suction traps, etc. Pest monitoring methods are usually very time consuming and require significant investment in species identification after manual trapping in the field.
Trap catch data serves several purposes: 1. ecological studies; 2. tracking insect migration; 3. new arrivals in agroecosystems; 4. initiating field surveys and sampling; 5. timing of PPP applications; 6. defining phenology models; 7. predicting generation size; 8. pest control.
Predicting pests is an important part of the strategy of IPM as well as in organic farming. Early warnings and forecasts based on biophysical methods provide a lead time for managing an impending pest infestation and can thus minimize crop losses, optimize pest control, and reduce the cost of cultivation.
There is also a need to prevent secondary damage and spread through continuous monitoring by supplementing primary control with conscientious control according to planned pest management methods. As monitoring is carried out throughout the vegetation period, it is necessary to focus on a large area in a short period of time, taking into account the time when the damage occurred intensively and the time when control can be carried out.
Insect pests monitoring trough traps
Trap catches can warn of the presence of pests, hot spots, and insect migration and activity, and provide a relative measure of insect density. Comparisons of the number of adult pests trapped on specific sampling dates can indicate whether pest densities in crops are changing or remaining relatively constant over the long term. Evaluation of trap catches can help determine treatment needs, timing of applications, and effectiveness of previous control measures.
Among the various methods and devices used in pest monitoring, the most popular and widely used are sex pheromone traps for selective monitoring of individual flying species, light traps for flying species attracted to light, and coloured sticky traps for species attracted to colour. While adult males are usually caught in sex pheromone traps, adults of both sexes are caught in light traps and coloured sticky traps. Light traps and coloured sticky traps can be used to detect species presence and to study population distribution and movements (migrations in the ecosystem) in a given area. Sticky traps have provided interesting results and can be considered as unbiased recording systems. They do not require a power source and are inexpensive, but their inspection for identification and eventual collection of trapped insects can be difficult and time-consuming, and their handling is relatively cumbersome.
a) Sex pheromone traps
Pheromones are messenger substances used for species-specific communication. Normally, these pheromones are produced by females to attract males. Commercially, they are produced by synthesizing the appropriate components and putting them into dispensers that can be placed in traps of various designs, depending on the production.
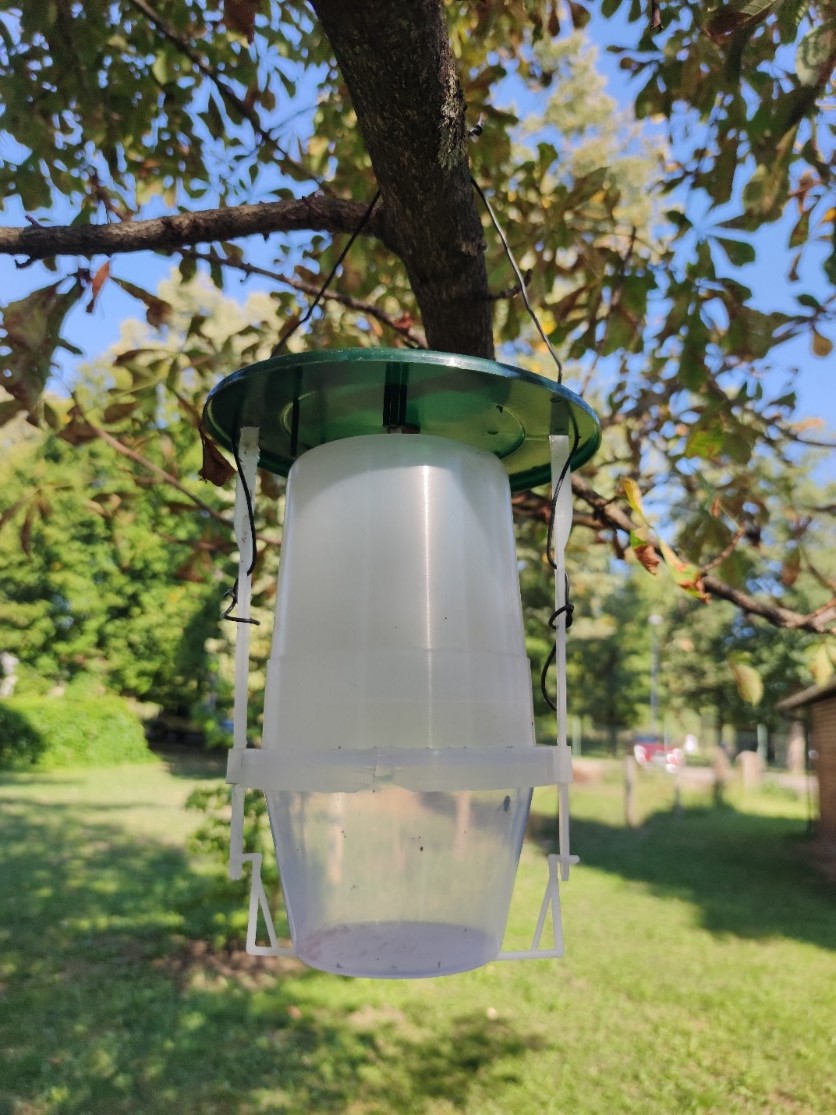
Sex pheromone traps are useful for monitoring pests that evade early detection of economic damage. Using pheromone traps (Figure 2.3), it is possible to monitor the occurrence and abundance of adult pests and predict crop damage in the following year. Once key habitat parameters have been identified, it is possible to predict infestation levels on an annual basis, thereby informing farmers of appropriate control strategies required for this and the following year's crop. For example, larval emergence can be predicted based on the abundance of adults and eggs in the year prior to repeated sowing of a particular crop.
According to good agricultural practice (e.g., Ministry of Agriculture), pest management must be based on population-level forecasts that comply with the principles of IPM. Determining the factors that positively or negatively influence or limit the growth of pest populations facilitates the development of IPM strategies aimed at slowing the spread of individuals and thus mitigating damage to crops at the national and possibly international level.
b) Coloured sticky traps
The coloured trap is the most efficient method of monitoring the crop for insect pests and can often indicate the presence of the insect early enough for other control measures to be taken. Sticky traps are used as one of the effective strategies for monitoring various insect species. They provide a simple method for estimating pest population density, require low cost and low skilled labour, and are helpful in developing an environmentally friendly control strategy. As a result of estimation with sticky traps, there is generally a reduction in PPPs use, which in turn leads to lower input costs, reduced exposure of workers to PPPs, and ultimately lower PPPs-related phytotoxicity and costs, which directly affect the quantity and quality of yields. Sticky traps are economically affordable as they cost less and require less technical work.
Sticky trap pest control uses an adhesive-based trap to monitor, trap, and immobilize pests. These types of traps are typically made of cardboard with a layer of sticky glue or plastic traps with renewable clue layer. The cardboard can also be folded into a tent shape or laid flat. The tent cover protects the glue surface from dust and other materials. Some glue traps also contain some type of scent to attract certain pests.
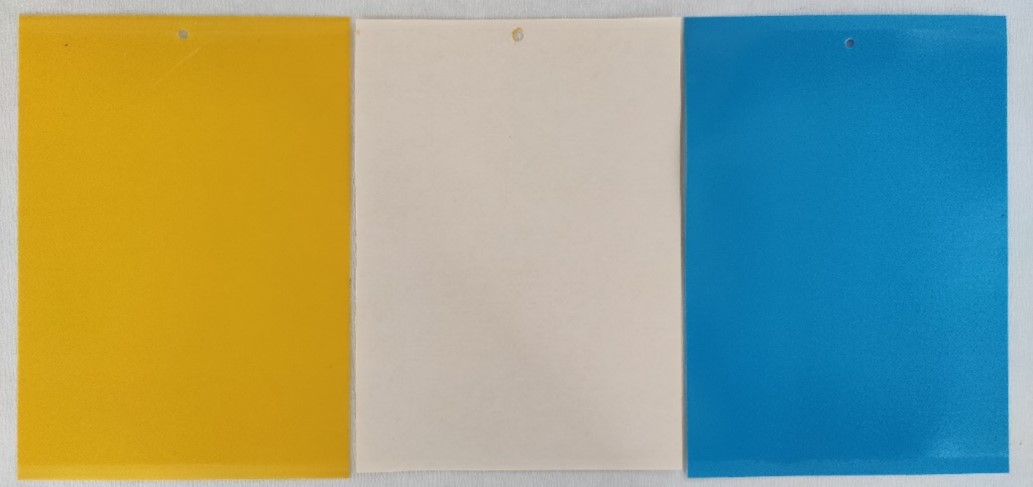
Sticky traps attract insect pests with a specific colour spectrum (Figure 2.4). They do not require bait or attractants but can be enhanced with essential oils such as Melissa, Lemon or Cinnamon Oil. Most animals exhibit the species-specific colour preference that corresponds to a specific range of the visible light spectrum in an individual. Insect colour preference is a rather striking phenomenon that has attracted attention in the basic and applied sciences.
Bright yellow (about 550 to 600 nm wavelength) is highly attractive to many insects. Adult whiteflies, thrips, leafminers, psyllids, shore flies, winged aphids, and parasitoids can be monitored with yellow sticky traps. As an example, the use of yellow sticky traps in seedling production with 1-2 traps/50-100 m2 can catch a significant number of whiteflies. Blue sticky traps are most attractive to western flower thrips and some other thrips species.
Traps provide a relative measure of insect density; comparing the number of adults trapped between sampling dates can indicate whether pest densities are changing or remaining relatively constant over the long term.
c) Light traps
The use of light to sample night-flying insects is a long-established technique. Light traps are most used to sample moth fauna (e.g., European corn borer Ostrinia nubilalis), but they also collect other insects, including adult aquatic insects (e.g., mayflies, dobsonflies, and caddisflies).
Depending on the intended use, there are many methods and variations that utilise an ever-changing technology. Light traps are best for population surveys or determining the geographic distribution of night-flying insects. This is because many species that are caught at night are practically undetectable using other sampling methods. Light traps for native insects potentially reveal a rich diversity of many different insects. It provides information on species diversity across all seasons, landscapes, ecological areas, elevations, and times of night. The light does not attract insects - it confuses them and takes them off their chosen flight path. Some insects fly repeatedly around the light, others simply settle at different distances from the light and fly away after different times. Insects see green, blue, and near ultraviolet (UV) light very well, but yellow and orange light they see poorly and red or infrared light they cannot see. Different types of light sources produce light at different wavelengths (colours) and are therefore differently effective for catching insects. Light traps are most effective for sampling night-flying insects in close proximity - up to 500 m from the light source. A light can be effective over greater distances - up to 1 km or more - if placed slightly elevated. Effectiveness depends on wind direction, as insects fly into the wind, and on wind speed, as many insects settle in strong winds. Flight activity also depends on temperature and humidity, and rain can stop or reduce it. Therefore, care must be taken when using light trap catches for comparative purposes such as monitoring. This requires keeping as many variables as possible the same or as close as possible each time. This is called standardisation.
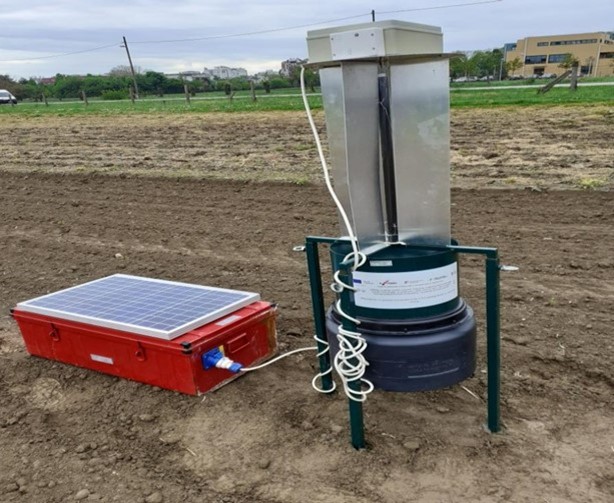
There are many types of light traps; they can be powered by 240 V AC or 12 V DC, UV or white light (full spectrum) lamps, and they can collect insects live or act as a killing trap.
Collections from a light trap provide important information about the diversity of nocturnal insects, their respective affinities for different wavelengths of light, and for understanding and predicting how populations function. Such information, when properly documented, can be used by field researchers in multiple ways, such as selecting light traps to attract specific orders of insects.
The light trap's passive sampling, retention of live specimens, and low cost have led to its widespread use for recording insect diversity in terrestrial environments. For example, light traps have been used consistently and widely since the 1940s for standardized mosquito monitoring, as well as for monitoring moths and other species considered pests.
Crop Disease Monitoring
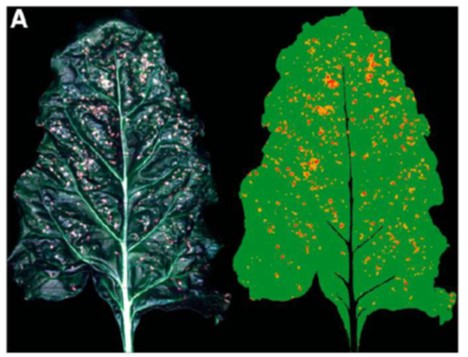
Monitoring plants and diseases in their early stages is of paramount importance, as it can prevent damage and allow for early action. In the past, detection and cure of plant diseases was done by the expert in the field. Disease monitoring requires a tremendous amount of work and time. Disease identification and diagnosis can be done directly on the plant. Manual monitoring of diseases does not give the desired result as naked eye observation is unreliable and increases the chances of misdiagnosis. It also requires the attention of an expert, which is time consuming and expensive. Therefore, manual methods are ineffective. Automatic and instantaneous plant disease detection is important to detect the symptoms of diseases at early stages when they appear on the growing leaf of the plant. It is used to segment the leaf, extract characteristics and classify it based on its appearance.
Some approaches focus on establishing a plant disease surveillance network based on the use of mobile phones, while others use satellite imagery. The disease detection aspect of the surveillance module uses computer vision and machine learning to detect plant diseases based on leaf images. However, leaf-based approaches rely on the use of imaging devices in low-resource approaches that use smartphones. This may be limited in areas with no or low smartphone usage.
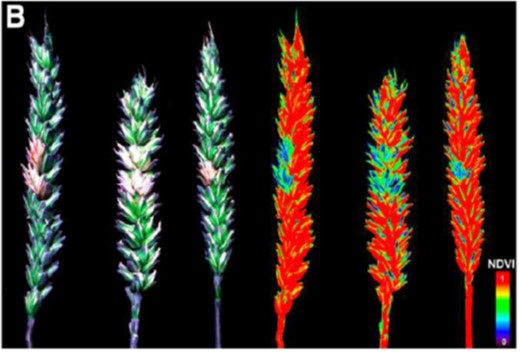
In observing pathogen and host interactions, various plant diseases and pests would cause a variety of symptoms and plant damage, providing a physical basis for their remote monitoring. It should be noted that not all plant diseases are suitable for remote sensing, as some of them do not have identifiable characteristics. On the other hand, some soil-borne and root diseases that have systemic effects on plant physiology can be detected. Therefore, an essential requirement for the detection and monitoring of plant diseases and pests by remote sensing is the presence of a specific response that can be detected by a specific sensor or sensor system.
Weed Monitoring
Weed monitoring is the first step in any site-specific weed management program. Site-specific weed management (SSWM) is a strategy in which weed control is varied within a field to match variations in location, density, and composition of the weed population. This concept is based on the fact that weed populations are often irregularly distributed within a field.
Most herbicides are only effective against certain weed species. Regular monitoring is used to determine if treatments are working. Weeds often grow in patches, so it may not be necessary to spray postemergent herbicides or till the entire field to control them. Spot treatment can save time and money while achieving good weed control.
The most accurate method of estimating the population of weeds is to count the number of plants in an area of known size in several places. A quadrant, which may be square or circular, should be used to make weed plant counts. The number and location of counts needed to estimate the population will vary depending on the distribution pattern.
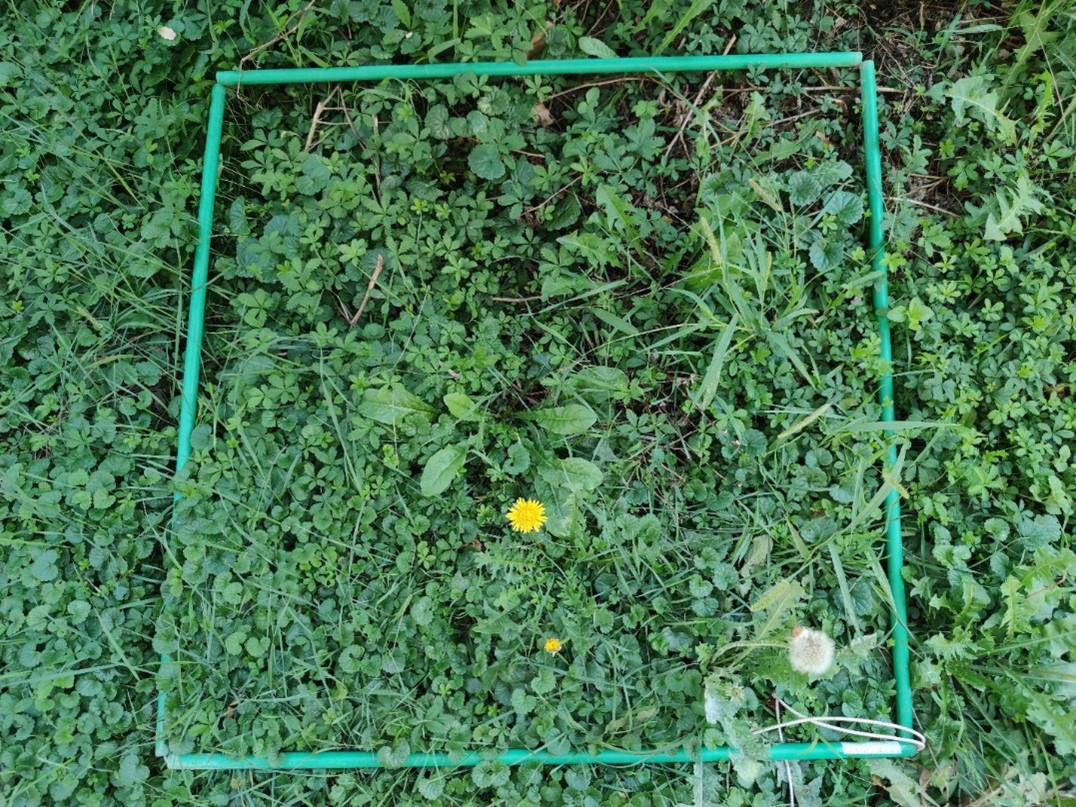
The size of the quadrant depends on the weed density. Small quadrants (0.1m2) are sufficient for weed populations of more than 200 plants per square metre. This would equate to more than 20 plants per quadrant. For lower weed densities, increase the quadrant size (up to 1 m2) to allow counts between five and 50 plants per quadrant.
At least five quadrant counts should be made in at least four sections within a field, giving 20 counts for the area. The more counts conducted, the more accurate the assessment.
Record plant count for each weed species found. The plant count is an appropriate time to record various aspects of the weeds and the stand. Note whether the plants appear small and crippled or are infested with insects or disease. It is also necessary to make notes about other weeds present. The records should be able to be queried and show changes in weed density and spectrum over time. These records can be an early warning of an emerging problem.
Pest forecasting (prediction)
Pest prediction must consider several intrinsic characteristics of the pests and the determining environmental and host factors. Most pest prediction models consider the phenology of the pest and its host. Accurate prediction of pest infestations before they occur is desirable in pest management programmes so that control measures can be planned with maximum efficiency. Pest dynamics show variations in timing and intensity depending on location and season.
Pests in agroecosystems are undergoing rapid environmental change due to changing cropping systems and a variety of management interventions. As a result, plant pests show a higher degree of instability in population levels. Pests vary in their biology and in their response to their environment. Pests in colder climates generally have discrete generations and dormancy periods in their life cycles, whereas in warmer climates most species show polymodal patterns of occurrence, with multiple generations in a year, due to continuous reproductive opportunities and food availability. On a global scale, seasonal temperatures and precipitation patterns are important factors determining the distribution of organisms.
Globally, an important outcome of understanding population dynamics is to strive for a predictive capability to make appropriate management decisions. Successful predictive techniques are those that are as simple as possible and based on knowledge of the biology and ecology of the pests of concern.
Due to climate regulation, the occurrence usually takes place in a relatively short period of time and is not too difficult to monitor. Pests that survive on alternative hosts can be sampled so that an estimate can be made of their probable pest density on the main crop.
Insect prediction models
Insects are unable to regulate their temperature internally, and therefore their development depends on the temperature to which they are exposed. Studies of insect population dynamics often involve modelling growth as a function of ambient temperature.
The most common model for development rate, often called degree-day summation, assumes a linear relationship between development rate and temperature between lower and upper development thresholds. This method works well for optimal temperatures. Temperature-dependent development in insects can also be considered over developmental time. Degree-day models have long been used as part of decision support systems to help farmers predict when to spray or when to control pests.
Ecological life tables are one of the most useful tools in the study of population dynamics of insects with discrete generations. Such tables record a series of sequential measurements that reveal population changes during the life cycle of a species in its natural environment. Long-term data from carefully designed population studies, in which all relevant factors have been accurately measured, are important for constructing population models that are appropriate to biological reality. The goal of life history analysis is to develop a population model that mimics reality. In addition to generating population estimates, this analysis is best done by carefully identifying and measuring the independent factors that cause mortality, such as parasitoids, predators, pathogens, and weather factors. From life table studies, the key factor responsible for increases and decreases in numbers from generation to generation can be identified.
Plant disease forecasting
Plant disease forecasting is a management system used to predict the occurrence or change in severity of plant diseases. At the field scale, these systems are used by farmers to make economic decisions about disease control treatments. Often the systems ask the farmer a series of questions about host plant susceptibility and incorporate current and predicted weather conditions to make a recommendation. A recommendation is usually made as to whether disease treatment is necessary.
Prediction systems are based on assumptions about the interactions of the pathogen with the host and the environment. The goal is to accurately predict when the three factors-host, environment, and pathogen-will interact in such a way that a disease may occur and cause economic losses.
Prediction systems can use one of several parameters to calculate disease risk, or a combination of factors. One of the first prediction systems developed for Stewart's wilt (Pantoea stewartii) on corn was based on the winter temperature index, since low temperatures would kill the vector of the disease so that there would be no outbreak.
A rational method of predicting disease should be based on the following factors:
- Factors (microclimatic) affecting the initial occurrence and subsequent spread of the inoculum.
- Thorough knowledge of the life cycle of the pathogen.
- The way the pathogen spreads.
- Rough estimate of the quantities of inoculum expected to be spread via propagules, soil, air, vectors, etc.
- Mechanism of host infection.
- Knowledge of the susceptibility of the host plant at different growth stages.
- Meteorological data (macroclimatic conditions) of the area.
Estimating potential weed population density
Potential weed population density can be estimated in several ways. If weeds produce seeds, count the number of seed heads or pods and the number of seeds per pod or seed head on a given sample plot. This gives an estimate of the total number of seeds produced.
A more complex but accurate method is to take soil cores, sieve and wash these samples, and count the seeds in these samples. This technique is often of limited use as a research tool because it is time consuming and depends on seed identification skills.
Irrigate small areas and identify and count germinating weeds. This can be done in the fall but does not always provide a realistic indication of potential weed emergence due to the complex nature of seed dormancy. Using records from past monitoring provides an assessment of aspects such as weed species, density, seed set and location. It allows monitoring of changes over time.


