1.4 Learning cycle in FFS and facilitation of the scientific attitude
| Site: | TOPPlant Portal |
| Course: | Training Manual for Plant Protection in Organic Farming |
| Book: | 1.4 Learning cycle in FFS and facilitation of the scientific attitude |
| Printed by: | Guest user |
| Date: | Tuesday, 25 November 2025, 11:22 PM |
Learning cycle in FFS and facilitation of the scientific attitude
Learning Outcomes:
- Describe concept of the FFS and its background.
- Prepare, integrate and conduct six steps of study for specialized courses in the field of the organic plant protection.
- Apply different matrixes for each steps aiming to support participants’ exploring and reflecting over their practices.
First, the facilitator must be aware that science is not reserved just for professional scientists. To facilitate scientific method enables farmers to learn about the basic principles and processes in their crop ecosystem. They do simple studies, compere treatments, and learn through their observations in the field. This approach (FFS) facilitates scientific attitude. Farmers learn to ask questions and a way to answer them.
Initial basic learning cycle aims to strengthen farmers’ skills and knowledge for critical analysis, to test and validate new practices and to assist in making informed decisions on field management. The learning process reinforces the understanding of complex ecological relations in the field. The learning cycle also aims to enhance participants’ group cohesion so that they can better work as a group, analyze questions or problem critically, draw on their own experience and observations and the experience and knowledge of others, create a consensus, and prepare for follow-up action once the learning cycle finishes.
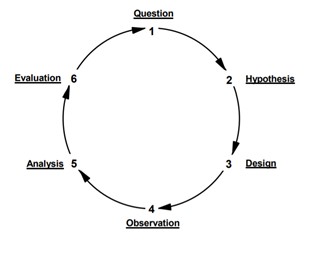
The learning cycle below represents six essential steps in conducting a study. It resembles an experiential learning cycle adapted for use in field study (Figure 1.2). Experiential learning is relevant for agricultural extension since it provides a means to work with groups to find their own solutions to problems through testing and experimentation of ideas and practices which are closely related to their own everyday farming activities. This is relevant for study of methods aiming to support farmers’ exploring and reflecting over their practices, since farmers’ knowledge is by nature experiential.

Six steps of conducting a study
First step: Question (Topic to be selected)
To help farmers formulating a question about their crop, the Topic-selection Matrix is used (Table 1.4).
| Problems (causes of low yield) | Current practice | Potential for improvement | Constraint concerning improvement | Suggested topics |
|---|---|---|---|---|
| Poor establishment | Broadcast seeding Uncertified seed | Transplanting may be better Certified seed |
Extra labor not available Cost |
Seed comparison |
| Improper application of N | Low use of fertilizers | Use of manure | Probably increases costs | Use of manure |
| Weeds | 2x mechanical weeding |
Increased weeding Increased flooding |
Labor costs Lack of control over irrigation |
Intensity of weeding |
| Rats | No control | Area-wide baiting;studies | Time, cost, Collaboration |
At the end of listing relevant problems, the group discusses the selection of the best topic.
As an alternative to just listening the problems, participants can start listing agricultural operations from seeding, through planting till harvest and identify possible problems. This method takes more time but considers all stages of farming to help farmers select their topic for study (Table 1.5).
| Agricultural operation | Current practice | Potential for improvement | Constraint concerning improvement | Suggested topics |
|---|---|---|---|---|
| Soil preparation | Shallow ploughing | Deep ploughing | Earthworms and other organisms are destroyed to improve the soil to benefit the crops | Organisms living in the ground Difference in the crop in ploughed and unploughed soil |
| Seeding | … | … | … | … |
| Harvesting | … | … | … | … |
Second step: Hypothesis (Ideas to be tested)
After selecting the topic for study, farmers must specify what exactly they want to find out. Idea Matrix is a tool which encourages farmers to consider all possible effects of the selected topic. The Idea Matrix (Table 1.6) is prepared after a topic for study has been determined. It consists of three columns.
In the first column farmers describe their ideas about the selected topic, by asking: "What possible influences will the topic of the study have on the crop system as a whole?"
These ideas should address influences:
- on the crop.
- on the ecosystem.
- on social and economic aspects.
In the second column farmers specify the source of these ideas; some ideas may be proven facts, others just thoughts not based on any facts, or they may be proven under different circumstances. In the third column farmers write what they think about each idea; is it true, is it reliable, is it relevant or applicable to the local situation; this is to determine whether the idea needs to be tested.
An Idea Matrix is of central importance for a study. These are the ideas which need testing. Farmers can use this matrix as a basis to plan their observations: Are yield samples sufficient, or should additional observations be made on weeds, plant growth, and insect levels? After completion of the study, the test results for each of the ideas is evaluated. Therefore, farmers should retain the Idea Matrix throughout the length of the study.
| Ideas - What possible effects will the topic of study have? | Source of each idea | What do we think about each idea? - Does it need to be tested? |
|---|---|---|
| Improved pest control will reduce the damage and increase the yield | Extension officer | Not convinced, needs to be tested locally |
| Successful pest control will reduce the sooty mold on fruits- more fruits will have good quality | Other farmers | Probably, need to observe |
| By controlling whiteflies other pest might become more dominant and make the other type of the damage | Experience of one of the farmers | Surely, but to what extent? |
| More labor and money are required to apply natural enemy | Farmers’ provisional calculations | Needs to be tested |
Third step: Design
The optimal design for a field study depends on the topic of study, on the condition and size of the field, and on the intensity of the study. Three principles are important for the design of a field study and if farmers consider these principles, they are able to design better experiments.
Principle 1: Natural Variation
Natural variation is found:
- between plants within a plot.
- between different parts of a plot.
- between field plots.
A study should compare treatments under the same conditions. Farmer researchers should understand the natural variation in their fields. Farmers may mention differences in land level, plant stand, weed density, soil compactness, soil fertility, non-uniform drainage or water supply. It’s important the participants discuss how natural variation interferes with the experiment and why it is important to reduce natural variation. First, it is important to select a field plot (a square piece of lawn) which is as uniform as possible. At the time of planting, however, some sources of variation may be hidden (e.g. soil fertility, compactness, seed bank of weeds).
To design a study on biopesticide application, we could divide the plot into three parts, or three treatments: 0 kg of biopesticide, 1 kg of biopesticide and 2 kg of biopesticide /ha. Replicates of a treatment should be distributed evenly over the plot, in good as well as bad parts of the plot. Hence, the different replicates give a reasonable representation of the entire plot. Treatments may be distributed randomly or regularly over the plot, but for small studies with few replicates a regular distribution is recommended. In a regular distribution, treatment plots do not border other plots of the same treatment (Figure 1.3).

Principle 2: Bias
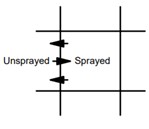
A treatment plot which is bordered by a plot with another treatment may well be affected by the neighboring treatment (Figure 1.4) and thus become biased. Bias, or interference, influences the quality of our results and occurs in the form of insecticide drift, fertilizer drift, movements of insects, etc.

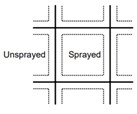
Suppose the central treatment plot is sprayed but it is bordered by an unsprayed control (as shown on the picture 1.3). What problems do you foresee? Spray may drift, pests may move away from the sprayed area, or natural enemies may get trapped in the sprayed area. As a result, the control is no longer a pure control but it has become biased (Figure 1.5). Do you expect bias in a study on fertilizers? How about a study on plant spacing?

The extent of bias apparently depends on the topic of study and the type of treatments. How can we overcome bias? First, bias can be reduced by increasing plot size. A study on pest management, where bias is strong, would require larger plots than a study on plant spacing. Second, bias is most important near the border of a plot and, to reduce bias, we could leave a border zone (around 1-2 m at each side) not sampled while we restrict our samples to the center portion of each plot. If we expect a bias through water flow (e.g. fertilizer drift) we should erect bunds as a barrier between plots.
Principle 3: Simplicity
The study design should be kept as simple as possible. It allows more intensive and more comprehensive observations and leads to stronger conclusions. The experiment should address just one aspect/factor (e.g. the biopesticide dosage). If we have more aspects to observe, we need to study the factors one-by-one. Combinations of several factors - e.g. ‘biopesticide dosage’ and ‘plant spacing’ - does not provide accurate results.
The number of treatments should be kept to a minimum or the study becomes too complex which threatens the quality of observations and conclusions. Only two to four most important and most distinctive treatments should be considered. The control is the treatment where a certain practice is not applied (e.g. no spray).
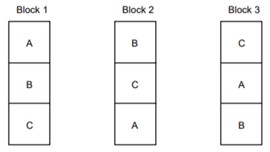
If farmers decide to use replication it is better to use a 3-by-3 design (3 treatments, 3 replicates). It is generally a good compromise with regard to limited plot sizes, within-field variability, and ease of observation and analysis by farmers. Therefore, there may be a need for 'blocks' in certain situations (Figure 1.6).
A block is a complete set of treatments which is separated from other blocks. Because of the separation, each block has its own natural conditions (e.g. different elevation, different soil, different timing of irrigation). It is advisable to avoid the use of blocks, if possible, by using a uniform plot in one location. By using blocks, we increase the extent of variation in our study results which makes it more difficult to obtain clear results.

Fourth step: Observation
Observation should be careful planned by farmers. By planning the observation, they should keep in mind to answer following questions:
- What should be observed? The different components of the ecosystem that need to be considered should be identified. For that task we use an Idea Matrix. For example, if we expect that an application of biopesticide influences other insects of the ecosystem, these components should be observed. We should avoid a situation where we only realise afterwards that we did not consider a certain component.
- How should observation be made? Observation should be practical and accurate. There are observations of individual plants (e.g. plant high measurements) or whole crop (e.g. yield measurements). Observations should give a reasonably accurate estimate from each replicated plot, realising that there is variation between plants, and between the different parts of each plot. In case of individual plant observation, a sample must consist of at least 10 plants per treatment in order to be representative. For yield measurements (e.g. 5x5 m) one crop cut at the centre of each plot replicate will be sufficient.
- When to observe? Yield measurements are taken at crop matrix or at harvest. Observations on weeds are most important during the early crop stages. Observations on insects, diseases and plant development are ideally made weekly during the entire season.
For planning an observation, it is very useful to prepare an Observation Matrix (Table 1.7).
| What should be observed? | How should observation be made? | When to observe? |
|---|---|---|
| Yield | 10 plants/ treatment harvested regularly | At each harvest, yield shall be recorded and at the end all yields on each treatment shall be summarized |
| Percent of fruits covered with sooty mold | At each harvest 50 fruits/ treatment shall be classified according to the presence of sooty mold in two categories: not present, present | At each harvest |
| Insects/diseases | Observe 10 plants per treatment | Weekly |
| Natural enemies | Observe 1o plants per treatment | Weekly |
| Inputs | Calculate and record costs | When inputs are made |
Separate records should be kept per treatment, and records of each sampling occasion should be summarised. At the end of the season, records could be summarised over all sampling occasions to allow for easy comparison between treatments.
Fifth step: Analysis
When analysing data from measurements one should be aware that each measurement gives a different result due to natural variation. So, replicates are necessary to confront natural variation in farmers’ fields. The average of all measurements provides a reasonable sample of the field plot under that particular treatment.
- Importance of variation: Understanding variation between the individual measurements is equally important as understanding average. Highly variable measurements are suspected and should be treated with caution before any conclusions are drawn. Uneven field conditions or poor observations can obscure results.
- Overlap test: A statistical tool was developed to examine variation between the measurements of each treatment. If variation is not inspected, premature or faulty conclusions might be drawn. The test consists of two steps:
In step 1 (Is the difference between treatments large?) the average is calculated for each treatment, in step 2 (Is there any overlap between minimum-maximum ranges of treatments?) we examine how variable or how uniform the measurements are. If data are uniform, we may find a clear difference between treatments, but if data are highly variable a difference between treatments are easily obscured by an overlap.
Sixth step: Evaluation
After all observations have been made, an evaluation of the complete set of data is necessary in order to draw final conclusions. An Evaluation Matrix (Table 1.8) helps to evaluate the data set. It evaluates the ideas formulated at the start of the study (from the Idea Matrix)
| Ideas to be tested (at the start of the study) | Results | Conclusion | ||
|---|---|---|---|---|
| Treatment 1 Untreated control | Treatment 2 Biopesticide 1 (neem oil) | Treatment 3 Biopesticide (Orius indigiosus) | ||
| Improved pest control will reduce the damage and increase the yield | 30 kg per sample | 43 kg | 45 kg | Application of biopesticide saved the yield but no clear difference between two biopesticides exist |
| Successful pest control will reduce the number of fruits covered by sooty mold - more fruits will have good quality | 20% of fruits covered with sooty molds | 7 % of fruits covered with sooty molds | 7 % of fruits covered with sooty molds | Application of biopesticide reduce the percentage of low-quality fruits, no difference between two biopesticides exist |
| By controlling whiteflies other pest might become more dominant and make the other type of the damage | Few pests, but slightly more Tuta absoluta in treatment 1 | Other pests exist but did not cause damage on any of treatments | ||
| More labor and money is required to apply biopesticides | No extra inputs | Extra input 30 €/ha | Extra input 100 €/ha | Most inputs required for Orius indigiosus treatment |
In drawing the final conclusion of the study, the farmer should not only consider their records, but also social aspects, environmental aspects and human health aspects. They can be in conflict with an increased economic benefit.
At the end of the study it is also important to ask following questions:
- Which aspects remain unknown?
- Which new questions are raised, and how could they be addressed?


